DeFi Analytics Finance Dashboard: A Template for Clarity
Navigating the complex, fast-moving world of decentralized finance feels less like traditional banking and more like piloting a spacecraft. You're monitoring volatile token prices, tracking liquidity across multiple pools, analyzing gas fees, and keeping a watchful eye on smart contract interactions—all in real-time. The challenge isn't a lack of data; it's a deluge of it. Trying to make sense of this information using spreadsheets or fragmented tools is like trying to read a star map through a keyhole. What you need is a command center—a single, coherent visual environment where complexity is translated into actionable insight. This is precisely the problem a well-designed DeFi Analytics Finance Dashboard template solves, transforming raw blockchain data into a clear narrative for your platform's users.
More Than Numbers: The Visual Language of Trust
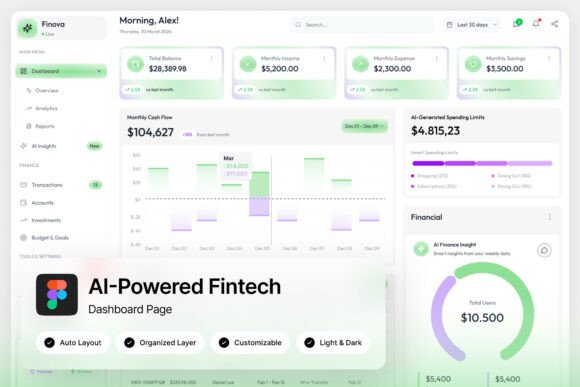
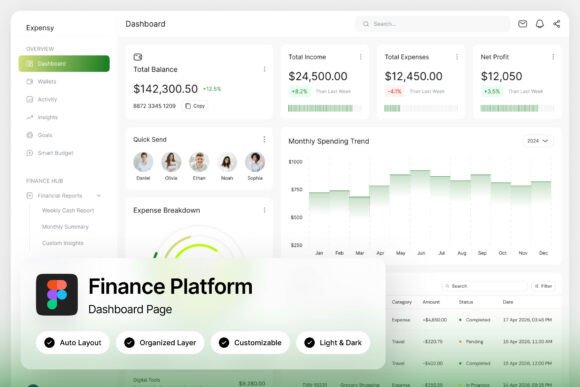
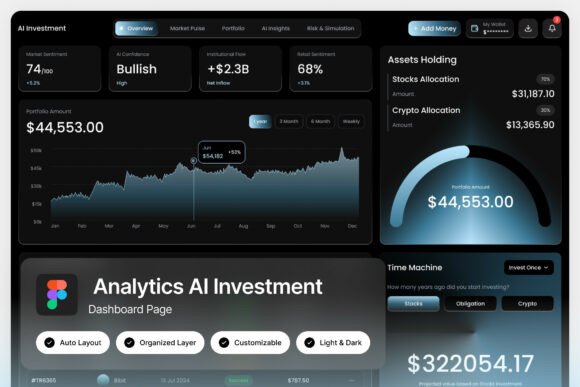
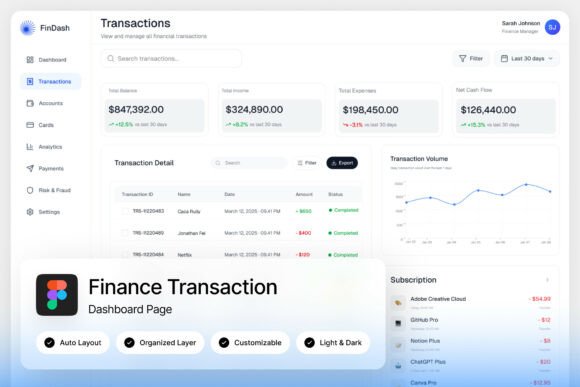
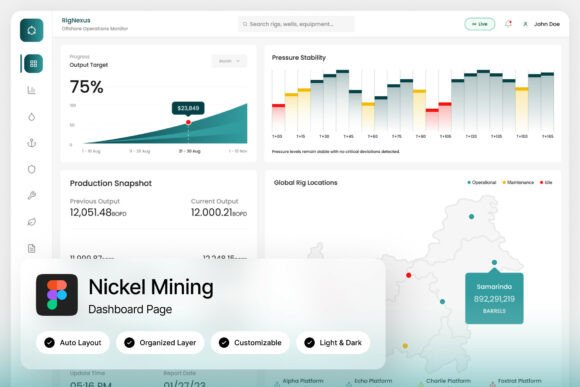
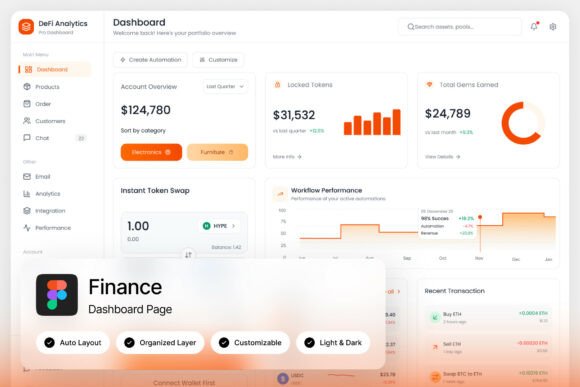
In the crypto space, perception is reality. A sleek, professional, and intuitive interface does more than just look good; it builds immediate credibility. When users land on your analytics platform, their first impression is visual. A futuristic, well-organized dashboard layout, like the one featured in this template, signals that the underlying technology is equally advanced and reliable. It uses a modern design language—clean lines, strategic use of color gradients, and sophisticated data visualization elements—to create a sense of security and expertise. This isn't just about aesthetics; it's a core component of your brand identity. A consistent visual system, from the dashboard to your marketing site, reinforces recognition and helps users feel confident they are interacting with a legitimate, cutting-edge service.
Practical Applications Beyond the Dashboard Itself
While the primary use case is clear, the assets within a high-quality design template are versatile components for a broader brand ecosystem. The carefully chosen typography, color palette, and iconography aren't confined to the admin panel. They become your foundational design assets for a wide range of creative and commercial projects.
- Marketing and Social Media: Use the dashboard's visual elements in explainer videos, social media graphics, and blog post headers to create cohesive content that immediately identifies with your brand.
- Pitch Decks and Investor Materials: A polished, professional presentation deck using the same design language as your product builds confidence with potential investors and partners.
- Website and Blog Design: Extend the template's style to your main website, creating a seamless user experience from the public-facing site to the logged-in application.
- Product Documentation and Guides: Design help guides and tutorials that are visually consistent with the dashboard, making them easier to follow and more professional.
- Merchandise and Event Materials: The unique, modern aesthetic can inspire designs for t-shirts, stickers, or conference banners, turning your user interface into a recognizable brand symbol.
This approach ensures every touchpoint, from a tweet to a printed brochure, feels intentionally crafted and unified, strengthening your overall brand narrative.
Choosing and Pairing Your Typographic Toolkit
A critical feature of a robust dashboard template is its use of free, accessible Google Fonts. This is a practical decision that empowers you. You aren't locked into expensive licensing for a proprietary typeface. Instead, you get a curated pair—a clean, highly legible sans-serif for UI elements and data, and a complementary font for headings or accent text. When selecting fonts for your own projects, the principles are the same: prioritize readability and purpose. A sans-serif font is typically ideal for dense data and body text on screens because its simple letterforms remain clear at small sizes. A more distinctive display or serif font can be used sparingly for headings to inject personality. Always test font pairings in context. Does the heading font overpower the body copy? Is there enough contrast in weight and style without creating visual conflict? The goal is a harmonious hierarchy that guides the user's eye naturally.
Ensuring a Flawless and Adaptable Implementation
The true value of a "pixel-perfect" and "fully customizable" template lies in its adaptability. Well-organized, named, and grouped layers in a design file like Figma are not a minor detail; they are a massive time-saver. They allow you to quickly locate elements, swap color themes between light and dark mode, and adjust layouts without breaking the design system. This modularity is key for scaling your project. You can confidently hand the design file to a developer, knowing the structure is logical. Furthermore, the inclusion of a help guide demonstrates an understanding of real-world workflow—it’s there to smooth out any bumps during customization. Before finalizing your implementation, always consider the end-user's experience. How does the layout hold up on different screen sizes? Is the color contrast sufficient for accessibility? Does the visual hierarchy effectively prioritize the most critical data points? Answering these questions ensures the dashboard isn't just beautiful, but fundamentally usable.
In the end, a powerful DeFi Analytics Finance Dashboard template is more than a collection of screens. It's a strategic toolkit for visual communication. It provides the structural integrity and aesthetic polish needed to present complex information with clarity and confidence, building the trust that is the ultimate currency in the decentralized world.