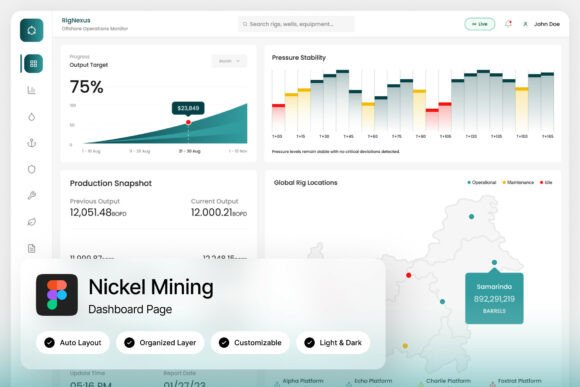
RighNexus Nickel Mining Dashboard: Industrial Analytics Visualized
In the world of heavy industry, data is the lifeblood of operation. But raw numbers on a spreadsheet rarely tell the full story of efficiency, resource allocation, or production health. This is where the visual power of a dedicated interface comes into play. The RighNexus Nickel Mining Dashboard template is built specifically to transform complex mineral analytics and operational data into a clear, actionable visual command center. It’s designed for those who need to monitor, analyze, and report on mining operations with professional clarity and modern design sensibility.
A Command Center for Modern Mining Operations
What sets this dashboard template apart is its focus on the unique visual language of the resource sector. It moves beyond generic data visualization to present information in a context that makes immediate sense to industry professionals. Think of layouts that map geological data against production output, or panels that track equipment health alongside shipment schedules. The design doesn’t just display data; it creates a narrative of the operation. The inclusion of both light and dark mode interfaces is a practical touch, acknowledging the different environments—from bright site offices to dimly lit control rooms—where this tool would be used. This thoughtful approach to user experience is what elevates it from a simple template to a potential operational asset.
Beyond the Control Room: Unexpected Applications for Industrial Aesthetics
While the primary audience is clear—mine managers, geologists, industrial data analysts—the strong, clean aesthetic of a mining dashboard has surprising versatility. The structured layouts, professional data visualizations, and muted, earthy color palettes can lend an immediate sense of solidity and expertise to a range of creative projects. Consider using elements from the template to inspire:
- Brand Identity for B2B or Industrial Services: A consulting firm specializing in resource management could draw from its organized, data-driven visual style to build a brand that communicates precision and reliability. The clean sans-serif typography often used in such interfaces is perfect for a modern, trustworthy logo design.
- Editorial and Report Design: Annual reports, sustainability whitepapers, or industry analysis pieces for sectors like energy, logistics, or advanced manufacturing could adopt its layout principles. The way it organizes dense information into digestible modules is a masterclass in editorial design.
- Packaging and Merchandise: For products targeting the outdoor, tactical, or technical apparel market, the dashboard’s utilitarian look can be adapted. Imagine pattern prints for packaging derived from its grid lines and chart motifs, or typography on merchandise that echoes the font choices in the Help Guide.
- Social Media and Digital Content: Creating a series of data-driven Instagram carousels or LinkedIn infographics about market trends? The dashboard’s visual language can provide a cohesive, professional template for presenting statistics and insights, making complex information more engaging.
This cross-pollination of styles is where modern design thrives. A premium font or a specific typeface isn’t just for the page it’s intended for; it’s a tool in your broader visual toolkit. The structured, analytical feel of the RighNexus Nickel Mining Dashboard can inform a whole suite of marketing assets, from website hero graphics to presentation decks, giving them a consistent, authoritative edge.
Practical Design Advice from a Resource Template
Working with a template like this offers more than just ready-made screens; it provides a framework for thinking about information design. Here are some takeaways you can apply to your own projects, regardless of the subject matter:
- Match Typography to Function, Not Just Fashion. The fonts used in a mining dashboard prioritize readability and clarity at various sizes. When choosing a typeface for your own project, consider its role. A bold display font might be perfect for a headline on a poster, but a clean sans-serif with multiple weights is essential for body text and data labels where legibility is paramount. Test how your chosen font performs at small sizes on a screen and in print.
- Let Data Tell Your Story. The dashboard’s strength is its visual storytelling. Apply this to your own work. Are you showcasing a project’s growth for a client? Use a simple, well-designed chart instead of a dense paragraph. Are you explaining a process in a blog post? A clear flowchart or diagram, inspired by the template’s logical layouts, can communicate more effectively than text alone.
- Embrace Organized Structure. Notice how the template uses named and grouped layers. This isn’t just a technical detail; it’s a philosophy. Keeping your own design files—whether in Figma, Canva, or Adobe Illustrator—well-organized with clear naming conventions saves immense time and prevents frustration, especially when collaborating or revisiting a project months later. It’s a hallmark of professional practice.
- Consider Your Environment. The light and dark mode options are a direct response to user context. Think about where your audience will encounter your design. A website viewed primarily on mobile phones in bright daylight has different contrast needs than a printed brochure read under indoor lighting. Test your color palette and font choices in the intended environment.
Leveraging the Asset: From Figma to Final Product
The true value of a resource like the RighNexus Nickel Mining Dashboard lies in its adaptability. The provided Figma file is not a static image; it’s a living document you can deconstruct and repurpose. The pixel-perfect layouts can serve as a structural guide for your own web design or app interface projects. The color schemes can be extracted and modified to suit a different brand palette. The layered components—buttons, charts, cards—can be isolated and integrated into your own design system.
Remember that the images in the preview are for demonstration. The real asset is the system itself: the grid, the spacing, the typography hierarchy, and the component library. When you download the ZIP, take time to explore the Help Guide. It often contains insights into the design decisions and practical tips for editing that go beyond the basics. Check the Font Links file to understand the exact typefaces used; you may need to acquire your own license for commercial use, which is a standard and important consideration for any professional project.
Ultimately, this template is a catalyst. It’s a starting point for building something new, whether that’s a fully functional operational dashboard for a mining client or a brand identity that borrows its confident, data-forward aesthetic. It demonstrates that good design is about solving problems—making information accessible, decisions clearer, and communication more effective. By studying its approach, you can bring that same level of intentionality and polish to your own creative work, transforming raw ideas into polished, professional presentations that resonate with your audience.