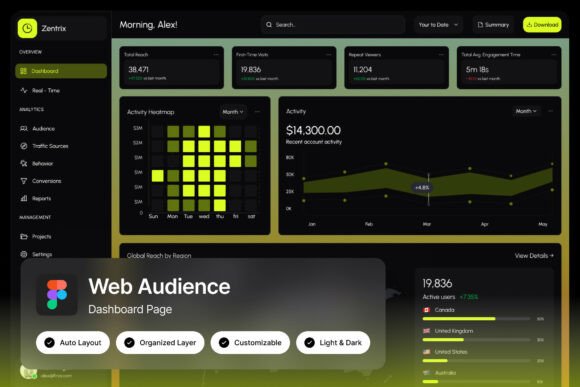
Zentrix Audience Dashboard: Deep Intelligence for Power Users
Imagine a command center where your website's audience data isn't just presented, but visualized with the clarity and intensity of a high-performance instrument panel. This is the core idea behind the Zentrix Audience Dashboard, a bold, dark-themed UI kit designed for those who live and breathe web analytics. Its signature yellow-green-on-black palette isn't just a stylistic choice; it's a functional one, creating high-contrast data points that pop against the dark background, allowing for rapid pattern recognition. For growth hackers, SaaS product teams, and analytics platform designers, this dashboard template is a foundational asset, offering a pixel-perfect, modern layout for building sophisticated audience intelligence tools.
A Visual Language for Data-Driven Decisions
The power of Zentrix lies in its ability to translate complex datasets into an intuitive visual narrative. The design features dedicated panels for audience segmentation, allowing you to visualize user cohorts side-by-side. A real-time visitor map provides geographical context, while heatmap indicators and engagement metrics are presented with immediate visual weight. This isn't a static report; it's an interactive environment. The fully customizable Figma file means you can adapt every element—from the color of a metric card to the layout of a segmentation panel—to match your specific product's brand identity or your client's unique data story. The included light and dark mode interfaces offer versatility, ensuring the dashboard can fit seamlessly into any design system or user preference.
Beyond the Dashboard: Applying Its Design Principles
While built for analytics, the design philosophy of Zentrix has compelling applications across various creative and commercial projects. Its modern, high-contrast aesthetic can be a springboard for other assets where clarity and impact are paramount. Consider how its bold typography and clean, organized layout could inspire:
- Brand Identity & Logo Design: The dashboard's confident, technical feel is perfect for brands in tech, SaaS, data science, or cybersecurity. The strong visual hierarchy demonstrates how to use typography and color to guide a viewer's eye, a crucial skill in crafting effective logos and brand marks.
- Marketing & Social Media Graphics: For campaigns targeting a professional or tech-savvy audience, the dark-themed, data-rich visual style can be adapted into compelling social media posts, webinar slides, or infographic templates. It communicates expertise and a focus on measurable results.
- Editorial & Web Design: The dashboard's layout principles—clear sections, strategic use of whitespace, and purposeful typography—can inform the design of data-heavy blog posts, annual reports, or feature-rich website sections. It teaches how to present dense information without overwhelming the reader.
The included assets, such as the well-organized, named layers and free Google Fonts, are practical tools that save valuable time. Instead of starting from a blank canvas, designers and developers can focus on customization and integration, using the Zentrix structure as a proven starting point for building their own unique design assets.
Practical Guidance for Your Next Project
Whether you're using the Zentrix file directly or drawing inspiration from its style, a few practical considerations will help you maximize its value. First, think about your project's core goal. Is it to inform, to persuade, or to guide an action? The Zentrix dashboard is built to inform at a glance, using visual cues to highlight what's important. Apply that same thinking to your packaging design or poster—what is the single most critical piece of information, and how can you make it visually dominant?
Second, pay close attention to typography and font pairing. The Zentrix template uses modern, clean typefaces that ensure readability across various data visualizations. When adapting this style for your own projects, consider pairing a strong, geometric sans-serif for headlines with a highly legible sans-serif for body text and data labels. Test your pairings at different scales to ensure they remain clear, whether on a large monitor or a mobile screen.
Finally, always review the licensing of any design assets you use. The Zentrix download includes a Figma file and guide, making it straightforward to understand its usage rights. For any font, especially when used in commercial projects like merchandise or digital products for sale, verifying the license is a non-negotiable step in professional practice. This due diligence protects your work and ensures you're building your brand on a solid, legal foundation.
In essence, the Zentrix Audience Dashboard is more than a UI kit; it's a masterclass in presenting complex information with style and function. It equips designers, entrepreneurs, and marketing professionals with a tangible asset to build better tools and a conceptual framework for creating more effective, visually consistent, and engaging communications across all their projects.