MerchantPro: A Dashboard That Makes Your Data Feel Human
Let’s be honest: most analytics dashboards feel like staring into the cockpit of a spaceship. They’re packed with numbers, charts, and metrics that are technically impressive but emotionally overwhelming. For the small business owner, the e-commerce manager, or the marketing team, the goal isn’t just to see data—it’s to understand it. To feel confident in the story it’s telling. That’s the quiet revolution happening with tools like the Merchant Analytics Dashboard, a UI that doesn’t just display information but presents it with warmth, clarity, and a surprising sense of calm.
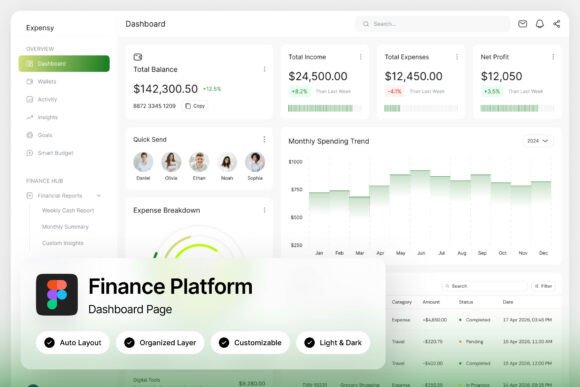
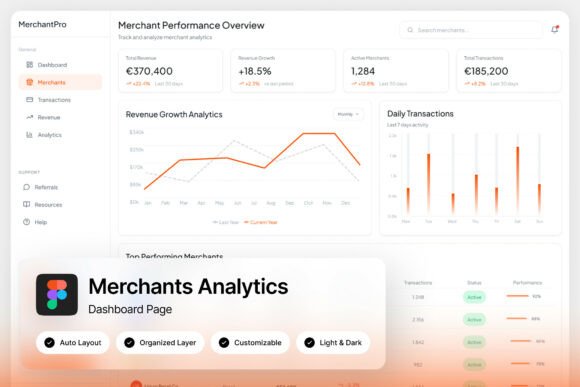
Imagine logging in to check your store’s performance and being greeted not by a cold, complex grid, but by a soft gradient palette that feels inviting. Sales performance charts flow with rounded edges, revenue summaries are presented with clear, digestible typography, and customer acquisition panels don’t scream for attention—they guide your eye. This is the core of the MerchantPro experience: a design that balances data density with genuine readability. It’s built for real people making real decisions, whether you’re running a boutique marketplace, managing a growing e-commerce platform, or designing the next great SaaS product for retailers.
Why a Dashboard’s Visual Language Matters More Than You Think
A dashboard is more than a tool; it’s the daily interface between a business owner and their business’s heartbeat. The visual design of that interface directly impacts how we process information, make decisions, and even feel about our work. A cluttered, high-contrast dashboard can induce anxiety, making trends hard to spot and insights feel buried. Conversely, a thoughtfully designed Merchant Analytics Dashboard like MerchantPro uses color psychology and layout hierarchy to reduce cognitive load. The soft gradients aren’t just aesthetically pleasing; they create visual grouping, helping your brain quickly categorize sales metrics from customer data without conscious effort.
This focus on human-centered design translates directly into practical benefits. When you can glance at a product metrics panel and instantly understand which items are underperforming, or when the customer acquisition cost is displayed in a clean, legible font against a calming background, you save time and mental energy. You’re not deciphering data; you’re absorbing insights. For teams, this shared clarity means meetings become more productive, strategies are aligned faster, and the entire organization operates from a single, visually coherent source of truth.
Beyond the Numbers: The Components of a Truly Effective Dashboard
What makes a merchant dashboard not just functional but exceptional? It comes down to a few key components working in harmony. First, sales performance charts need to be intuitive. Are they showing year-over-year growth, daily trends, or seasonal peaks? The chart type—whether a clean line graph or a simple bar chart—should match the question you’re asking. MerchantPro’s design excels here by offering multiple, easily customizable chart views that feel integrated, not bolted on.
Next, revenue summaries must be instantly scannable. The best designs use size and color weight to highlight the most critical number—like total revenue for the period—while keeping supporting figures (like refunds or discounts) accessible but subordinate. Then there are product metrics and customer acquisition panels. These are where many dashboards fail, burying vital information in sub-menus. A well-designed UI surfaces key product performance indicators—like inventory turnover or best-seller rankings—alongside customer lifetime value and acquisition cost, allowing you to see the full picture of profitability and growth in one unified view.
Practical Applications for Designers and Business Builders
If you’re a designer, entrepreneur, or part of an e-commerce team, the value of a premium dashboard template extends far beyond its immediate use. The design principles embedded in a tool like MerchantPro can inform your entire visual ecosystem.
- Brand Identity and Consistency: The color palette, typography, and iconography of a dashboard are the DNA of a digital product. Extracting these elements can help you build a consistent brand identity across your marketing site, email campaigns, and social media graphics. The modern, approachable style of MerchantPro is perfect for brands that want to appear trustworthy and innovative without being cold.
- UI/UX Inspiration: Studying how this dashboard handles data visualization, information hierarchy, and interactive states (like its light and dark modes) is a masterclass in practical UI design. These patterns can be adapted for everything from mobile app interfaces to interactive web elements.
- Presentation and Reporting: The clean, organized layouts are ideal for creating compelling internal reports or investor presentations. Instead of exporting messy spreadsheets, you can use the dashboard’s visual language to create slides that tell a clear, persuasive story with your data.
- Digital Product Development: For SaaS teams building marketplace or retail platforms, this template isn’t just a mockup; it’s a foundational component library. The pixel-perfect, well-organized Figma layers mean designers and developers can collaborate efficiently, speeding up the path from concept to a polished product.
The included features—like the 1440×1024px resolution, free Google Fonts, and a detailed help guide—make it a practical asset, not just a pretty picture. It’s designed to be immediately usable, which is crucial for fast-moving teams.
Choosing the Right Visual Tools for Your Project
Selecting a design asset, whether it’s a font or a dashboard template, should always start with your project’s core goal. Are you building a brand from scratch and need a cohesive visual system? Look for assets that offer versatility, like the light and dark mode options in MerchantPro, which can adapt to different contexts and user preferences. If you’re refreshing an existing product, consider how the new asset’s style—its use of soft gradients and modern typography—will complement or elevate your current design language.
Always test in context. A beautiful chart on its own might not work when surrounded by your product’s specific data streams. Use the customizable layers to input sample data and see how the design performs under realistic conditions. Pay close attention to readability: are the labels clear? Is there sufficient contrast? Does the information hierarchy hold up when you’re tired or in a hurry?
Finally, consider the long-term workflow. A well-organized Figma file with named and grouped layers isn’t a luxury; it’s a necessity for collaboration and future iteration. It respects the time of every designer and developer who will touch the project down the line. In a world where visual communication is paramount, investing in high-quality, thoughtful design assets like a comprehensive Merchant Analytics Dashboard is an investment in clarity, efficiency, and ultimately, better business decisions.